Reporting
Plots and tables from the mission
Dashboard (top bar, next to Design) is where you generate plots and report tables. Pick an asset, pick a template, then Generate.
Some templates need a finished analysis (coverage heatmaps, link margins). Others work from the spacecraft alone (position, altitude). Run the study first when the list looks empty.
Open Web App · first plot: Create your first mission
On a wide screen
- Switch to Dashboard.
- Choose Plots or Reports.
- Select the asset (spacecraft or analysis).
- Pick a template and click Generate Plot or Generate Report.
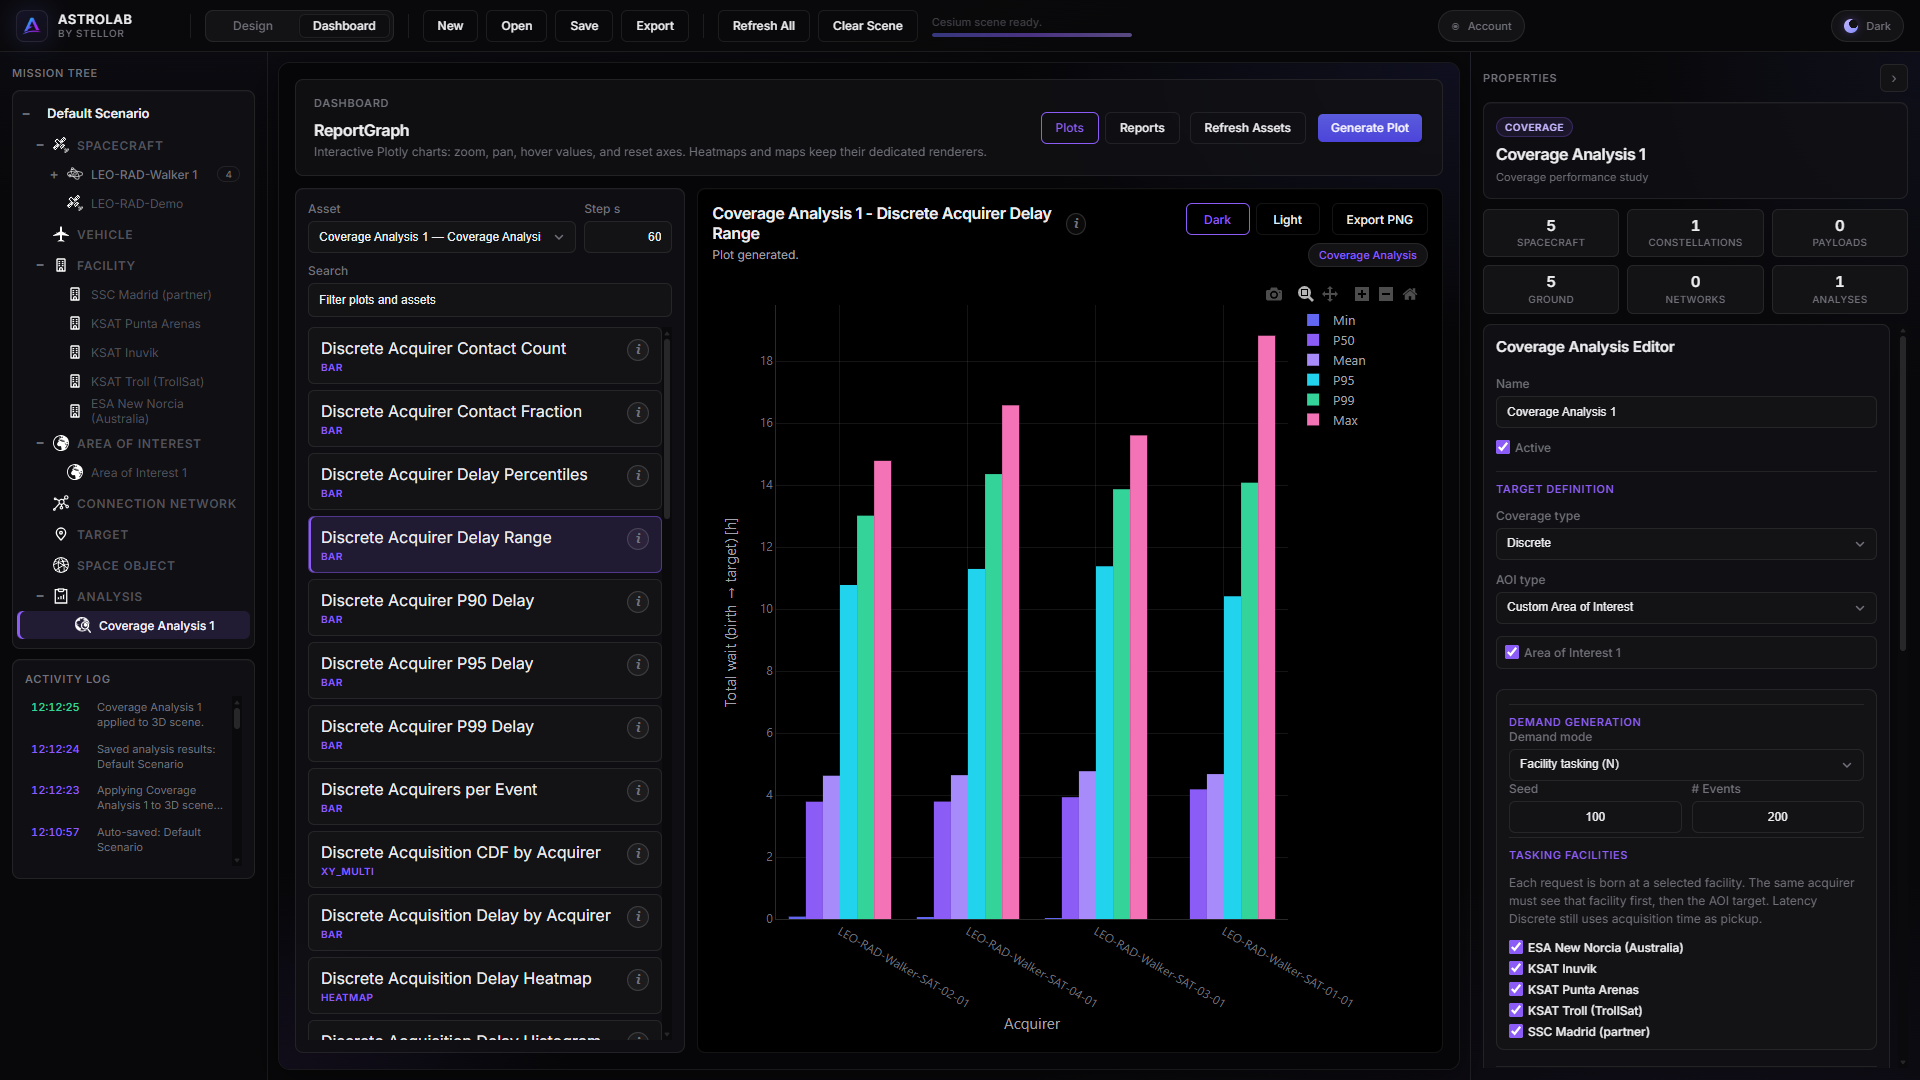
Dashboard — asset, template list, generate, result.
Trial can view results in the app. Downloading report files is on paid plans. Account and access.
On phone or tablet
Open Reporting from the menu. Generate stays above the template list; when it finishes, the view moves to the result. Mobile and tablet.
If the catalogue is empty
- Select the analysis asset, not only the spacecraft, for coverage or link products.
- Confirm the analysis status is completed, not failed or stale.
- After large mission edits, open Dashboard again so the list refreshes.
Template catalogue (what each plot is): Dashboard plots.