Running analyses
Configure, run, then inspect results
An analysis is an item in the Mission Tree (Coverage, Link, Power, …). You point it at the assets it needs, set options in Properties, then Run Analysis. When it finishes, use Dashboard for plots and tables, and Design for overlays on the globe when the study provides them.
Open Web App · catalogue: Analyses overview · first study: LEO Optical Satellite
How to run a study
flowchart LR
  Add["Add analysis"] --> Config["Configure in Properties"]
  Config --> Apply["Apply Changes"]
  Apply --> Run["Run Analysis"]
Run --> Dash["Dashboard"]- Right-click the Analysis category → Add the study you need (or add it from the parent the product expects).
- In Properties, select the spacecraft, sensors, AOIs, facilities, or networks the study requires.
- Stay inside your plan (grid size, mode, duration). Trial is enough for the optical tutorial.
- Apply Changes, then Run Analysis (tree menu or the button in Properties).
- Wait for the progress bar. Open Dashboard, select the analysis (or the spacecraft, depending on the template), and generate a plot.
If a setting is not allowed on your plan, ASTROLAB shows an upgrade message instead of running. Account and access.
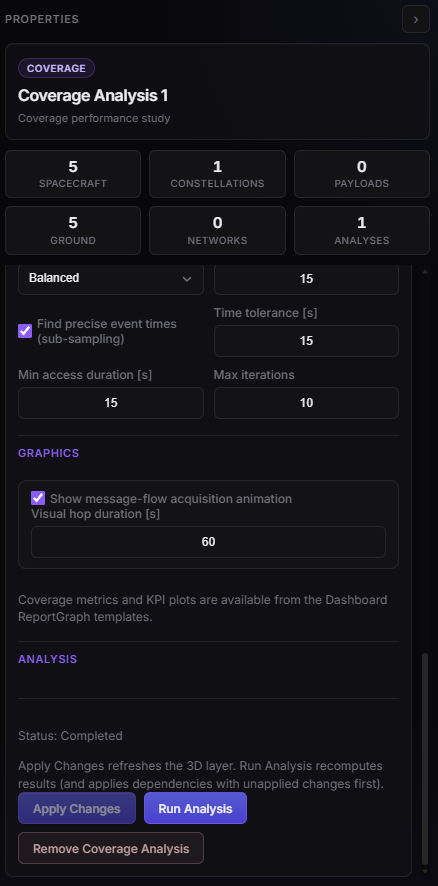
Analysis in Properties — configure targets, then Run Analysis.
After a run
| Status | What to do |
|---|---|
| Completed | Generate plots in Dashboard; look at overlays in Design if the study has them |
| Stale | You changed assets or the scenario after the run — run again |
| Failed | Read the message in Properties or the Activity Log; often a missing target, empty geometry, or a plan limit |
Full list of studies: Analyses overview.