Dashboard plots
Charts and tables from a completed run
Dashboard (top bar, next to Design) turns finished analysis results into plots and report tables. It does not recompute coverage, access, or power. If the list looks empty, run the study first and select the analysis in the asset picker — not only the spacecraft.
Workspace details: Reporting.
How to generate
- Switch to Dashboard.
- Choose Plots or Reports.
- Select the asset that owns the run (the Coverage, Link, Power, … item).
- Pick a template → Generate Plot or Generate Report.
Trial can view results in the app; downloading files is on paid plans.
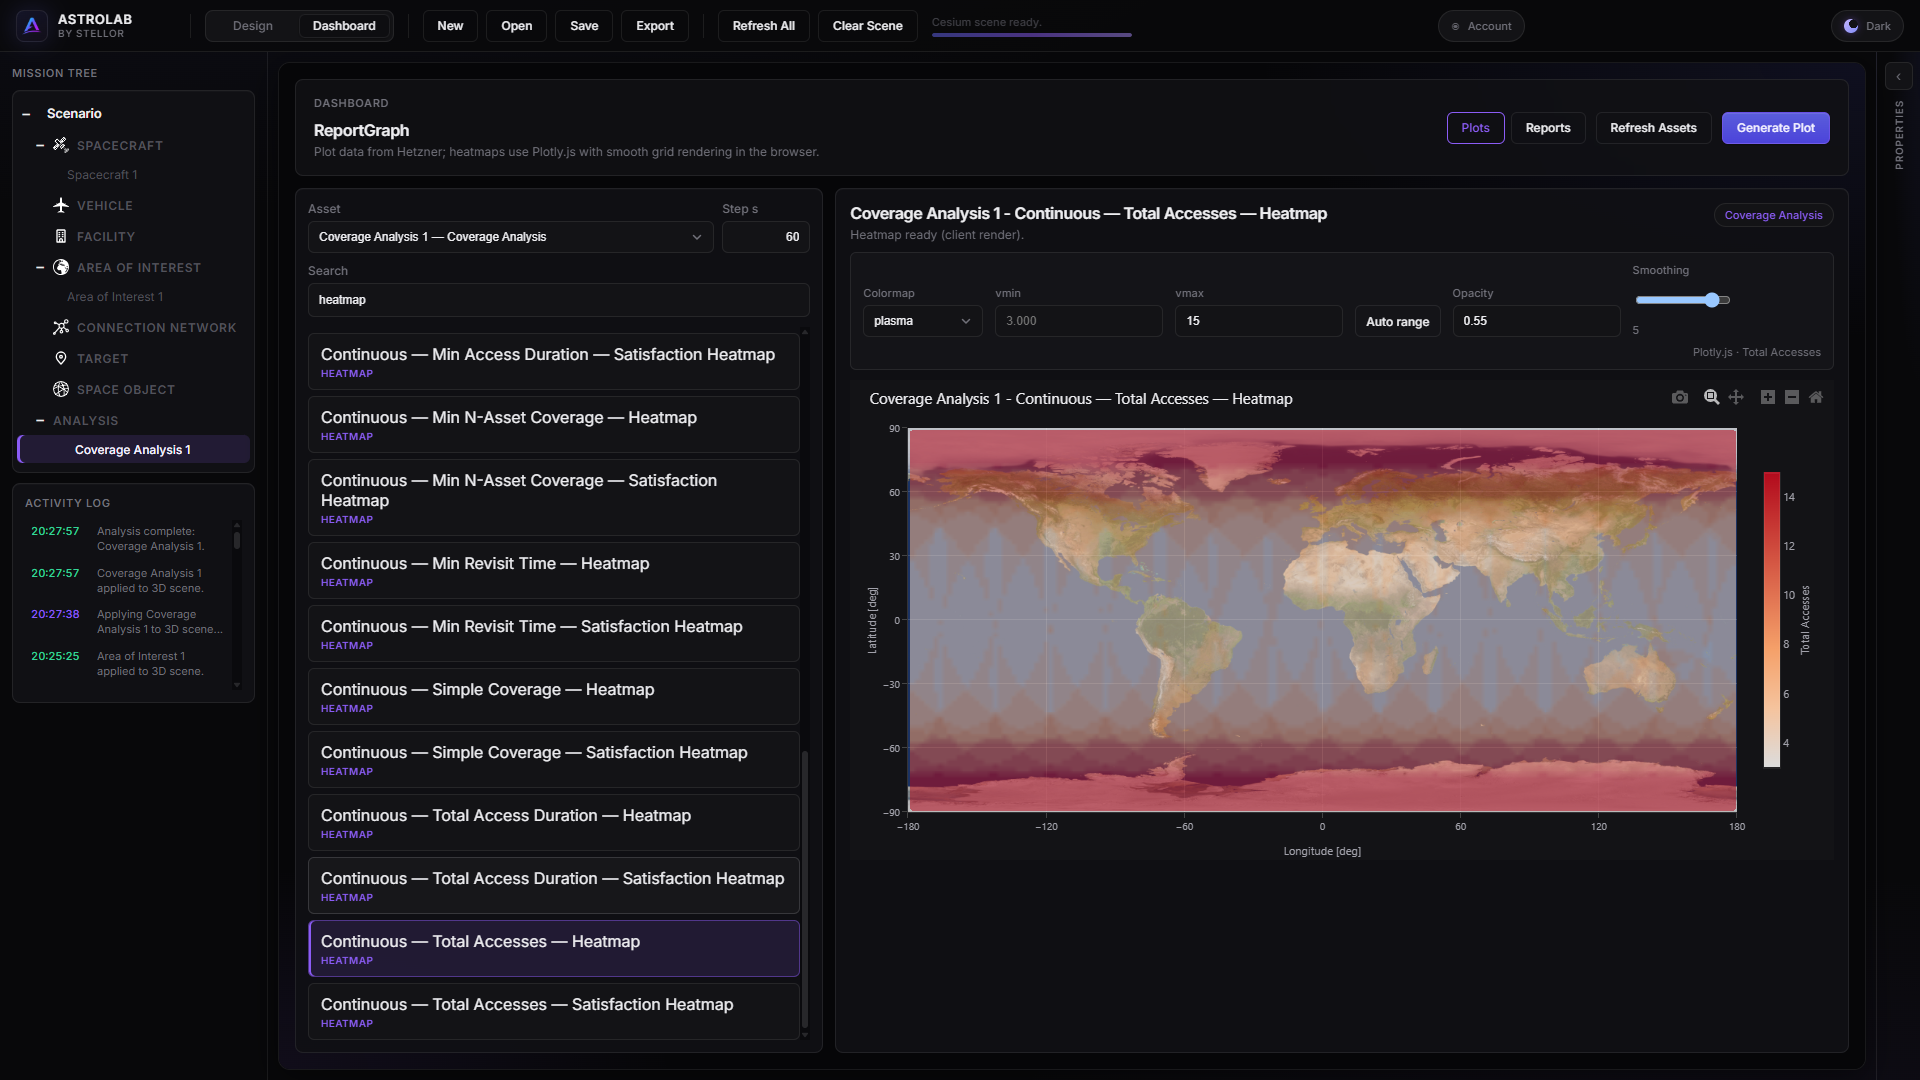
Dashboard — Plots: asset, template list, generated chart.
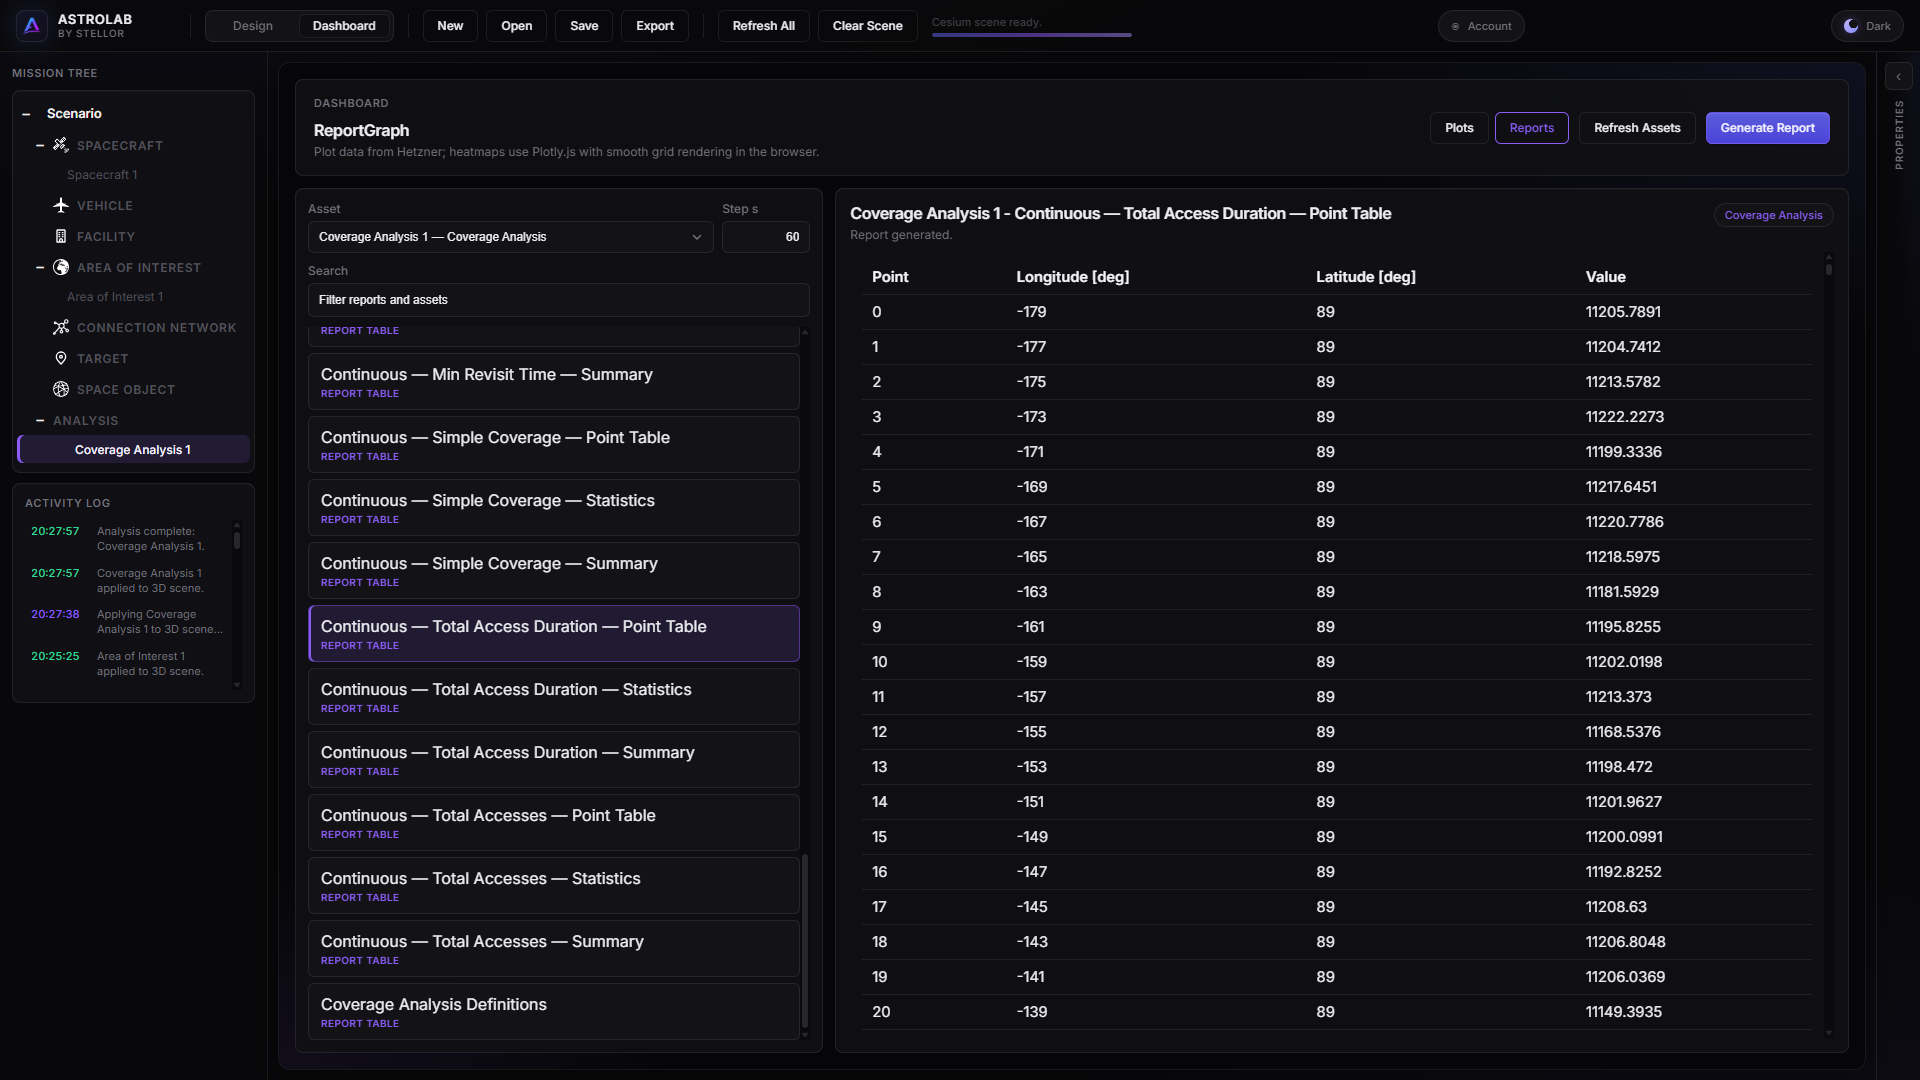
Dashboard — Reports: tabular product from the same completed analysis.
What to pick
| You ran… | Select… | Useful products |
|---|---|---|
| Coverage Continuous | That Coverage analysis | Heatmaps, percent covered, revisit / gaps |
| Coverage Discrete | That Coverage analysis | Chain outcomes, delay CDFs, delay legs, acquirer delay range |
| Coverage Static | That Coverage analysis | Access to the frozen sample |
| Link | That Link analysis | Sky plot, range, elevation; RF margin only if budget was on |
| Connection network | That network | Edge access windows |
| Routing | That Routing analysis | Unique A→B strand table |
| Latency | That Latency analysis | Delay to gateway, delivery / MMFU |
| Power | That Power analysis | Bus balance, SOC, shedding |
| Lifetime | That Lifetime analysis | Altitude / decay |
| Station keeping | That Station keeping analysis | Δv / maintenance |
| Spacecraft only | The spacecraft | Position, altitude, geodetic (no Coverage heatmaps) |
Open the (i) on a plot if the clock or metric name is ambiguous. Discrete templates named “Acquisition Delay by Acquirer” still plot TOTAL wait — see Coverage.
Spacecraft, facilities, sensors, and RF children also have asset-only templates (orbit, environment) that do not need an analysis run.
If the catalogue is empty
- Run completed, not failed or stale.
- Correct analysis selected.
- Geometry-only Link will not offer RF margin plots.
- After large edits, open Dashboard again so the list refreshes.